
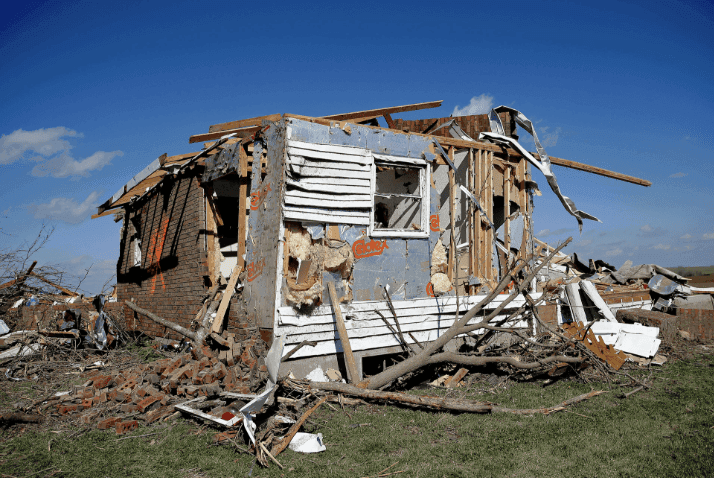
With only 12 U.S. billion-dollar weather and climate disasters confirmed through June 2026—fifth-highest for the January–June period and well below the 28-event record from 2023—trader sentiment leans narrowly against breaking the annual mark. Severe convective storms drove most early-year losses, but the balance hinges on uncertainties in the Atlantic hurricane season, including storm frequency, intensification rates under current sea-surface temperatures, and landfall probabilities along the Gulf and East coasts. Wildfire potential in the West and any late-year drought or freeze events add further variability. Updated seasonal outlooks from NOAA, revised damage assessments, and active tropical systems through October could rapidly shift the market-implied odds.
Experimental AI-generated summary referencing Polymarket data. This is not trading advice and plays no role in how this market resolves. · UpdatedWill the US break its record for billion-dollar weather and climate disasters in 2026?
Will the US break its record for billion-dollar weather and climate disasters in 2026?
The controlling figure is the number of billion-dollar events attributed to calendar year 2026 in Climate Central's report (https://www.climatecentral.org/climate-services/billion-dollar-disasters), using Climate Central's standard cost-estimation and inflation-adjustment methodology; Climate Central now stewards this NOAA/NCEI dataset under the same methodology and original lead scientist. Whether an event qualifies, and how events are delineated and counted, follow Climate Central's published enumeration. Preliminary or year-to-date counts released during 2026 do not determine resolution; only the count attributed to the full 2026 calendar year controls.
Climate Central typically publishes its annual tally in January of the following year. The controlling count is the figure Climate Central attributes to calendar year 2026 as reflected in its most recent publication as of June 30, 2027, accounting for any revisions Climate Central makes after its initial release.
If Climate Central has not published any count covering the full 2026 calendar year by June 30, 2027, resolution will be based on the most recent publicly available full-year 2026 count produced under the same NOAA/NCEI methodology by a credible successor steward. If no such count exists, this market resolves to "No".
Market Opened: Aug 19, 2026, 12:44 PM ET
Resolver
0x65070BE91...The controlling figure is the number of billion-dollar events attributed to calendar year 2026 in Climate Central's report (https://www.climatecentral.org/climate-services/billion-dollar-disasters), using Climate Central's standard cost-estimation and inflation-adjustment methodology; Climate Central now stewards this NOAA/NCEI dataset under the same methodology and original lead scientist. Whether an event qualifies, and how events are delineated and counted, follow Climate Central's published enumeration. Preliminary or year-to-date counts released during 2026 do not determine resolution; only the count attributed to the full 2026 calendar year controls.
Climate Central typically publishes its annual tally in January of the following year. The controlling count is the figure Climate Central attributes to calendar year 2026 as reflected in its most recent publication as of June 30, 2027, accounting for any revisions Climate Central makes after its initial release.
If Climate Central has not published any count covering the full 2026 calendar year by June 30, 2027, resolution will be based on the most recent publicly available full-year 2026 count produced under the same NOAA/NCEI methodology by a credible successor steward. If no such count exists, this market resolves to "No".
Resolver
0x65070BE91...With only 12 U.S. billion-dollar weather and climate disasters confirmed through June 2026—fifth-highest for the January–June period and well below the 28-event record from 2023—trader sentiment leans narrowly against breaking the annual mark. Severe convective storms drove most early-year losses, but the balance hinges on uncertainties in the Atlantic hurricane season, including storm frequency, intensification rates under current sea-surface temperatures, and landfall probabilities along the Gulf and East coasts. Wildfire potential in the West and any late-year drought or freeze events add further variability. Updated seasonal outlooks from NOAA, revised damage assessments, and active tropical systems through October could rapidly shift the market-implied odds.
Experimental AI-generated summary referencing Polymarket data. This is not trading advice and plays no role in how this market resolves. · Updated
Beware of external links.
Beware of external links.
Frequently Asked Questions